How we analysed the data
The chart shows the frequency with which individual terms or combinations of terms appear in transcripts from speeches and oral contributions made in the Russian State Duma from 1994 up until 2021.
In preparing and depicting the data, we based our procedure largely on that used by our colleagues over at Zeit Online for their project 70 Jahre Bundestag – Darüber spricht der Bundestag.
What data did we use?
The analysis is based on raw data pulled from about 385.000 transcripts from speeches and oral contributions published on the website of the State Duma between January 1994 and Mai 2021.
What procedure did we follow?
The first thing we did to prepare the data for analysis was to chop the filtered transcripts up into individual words, known as tokens. Then we removed all of the “stop words” from the token list – i.e. words like “and” (и), “so” (так) or “only” (только), which have no particular relevance for the analysis.
Individual terms can occur in a variety of forms (газета, газеты, газете, газету, …), so the next step was to standardise all the variants, i.e. change them all to their dictionary form, or lemma. In computational linguistics, this step is called lemmatisation. We used an algorithm developed by the Russian search engine provider Yandex for this.
We also searched the data for words that occur in two or three-word strings (known as n-grams) with particular frequency, because we were interested in combinations of words like “artificial intelligence” (искусственный интеллект) or “Great Patriotic War” (Великая Отечественная Война), as well as in individual terms.The last step was to count the number of times that the words and word combinations appear in the data associated with each individual year. To ensure that differences in the volume of material published in different years would not distort the results, we set up the tool to chart relative rather than absolute frequency; i.e. it shows the frequency with which a word or a combination of words appears per 100,000 words in a year.
What else should users keep in mind?
Like the original documents, the data may contain misspelled words. To keep the dataset to a manageable size, only terms occurring at least 15 times over the entire period are shown.
The data were derived from the State Dumas Russian-language publications. For the English version of the tool, we used the transliteration of the Russian terms or combinations of terms.
What kind of tool is this?
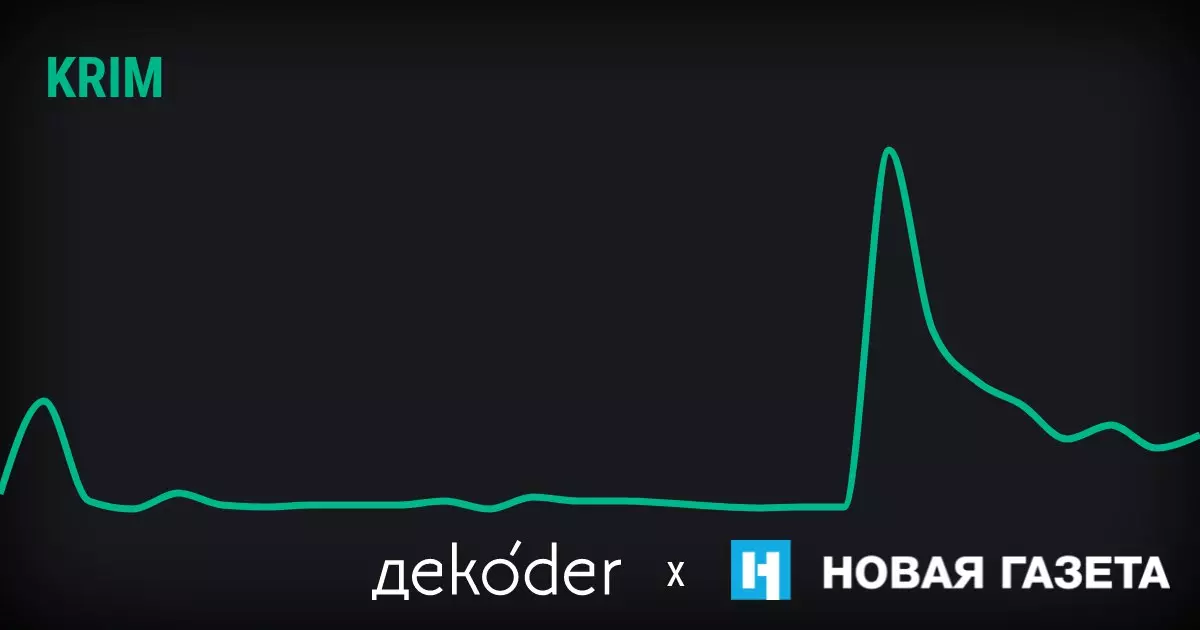
We have made a tool that shows when and how often State Duma deputies uttered certain words and phrases during their meetings.
How does it work?
It is very straightforward: in the search bar write any word or phrase, for example, , , the , or, alternatively, the word . If these words appear in the State Duma transcripts more than 15 times, a line will appear on the graph showing how frequently they are featured per year for every 100,000 words. Hovering your cursor over the graph will give you a complete breakdown showing which parties the MPs who uttered the phrases represent (or represented).
Incidentally, you could also look for the word . Or the word as well. Or the word .
By entering several words (or phrases) at once, you will get several lines on one graph. This might be useful when comparing how frequently certain words came up to find out, for example, who was talked about more often in the Duma: Yeltsin or Putin?
Here is the answer: .
The tool is also capable of linking words in order to give you a sum total. This could be particularly useful when several different names could be used for the same concept, or when something has been renamed. For example, you could search for the terms and separately, or together: . Simply drag and drop one word onto another.
In some cases linking two terms is absolutely necessary to get accurate results. So, for example, whilst looking up the term , one might wrongly assume that, over time, deputies began talking more about the Luhansk People’s Republic. In fact, this is not the case. It’s just that deputies began to use the abbreviation more often as time went by, and if you enter , this will quickly become apparent.
What if I can’t find something?
In this case, it is very likely that the word or phrase was uttered less than 15 times during the entire period of the State Duma’s existence.
However, sometimes the deputies may have used different terminology from that of the media, so a creative approach to search queries may be required. For example, it might seem that the second was mentioned less frequently in the Duma than the first. But only until we introduce the phrase .
Nevertheless, if you are still sure that something is wrong with the system, contact us.
We created the database with much attention to detail and compared the results with the transcripts using a range of different search terms. And yet, no one is entirely immune from committing errors. Even the Duma . And also them. According to the graph, this occurs once every three years. We’ll try to make it faster.
What else can you do with this tool?
You can save your searches using a special button in the upper right corner. The results will only be saved in your browser and will be displayed below the graph.
You can also share charts on social networks. Just click on the icons in the upper left corner and your subscribers will see this little beauty:


